11.4.2. Evaluating performance measures on saved waveforms
In the previous section we have shown how you can check which result tree node contains stored waveforms. For such nodes you can evaluate performance measures from these stored waveforms. Performance measures can be added by adding items under “Measures (post)” in the Postprocessing tree.
When “Measures (post)” is selected the right part of the results tab is divided in three part separated by splitters that can be moved around. The top part contains the status of the performance measure evaluation, a pushbutton for interrupting evaluation, a pushbutton for refreshing the values (triggering evaluation), and a checkbox for enabling automatic evaluation of all defined performance measures. Automatic evaluation is triggered whenever a change is made to the definitions of performance measures.
The middle part is dividen in two parts. The left part displays the values of performance measures in a table. Above the table are two selectors for filtering the displayed performace measure values according to the measure name and corner name. The “Failures only” checkbox limits the display to only those measure-corner pairs for which the performance measure fails to satisfy the requirements specified in its definition. The right part displays a log of measure evaluation. It can be used for debugging errors in performance measure definitions.
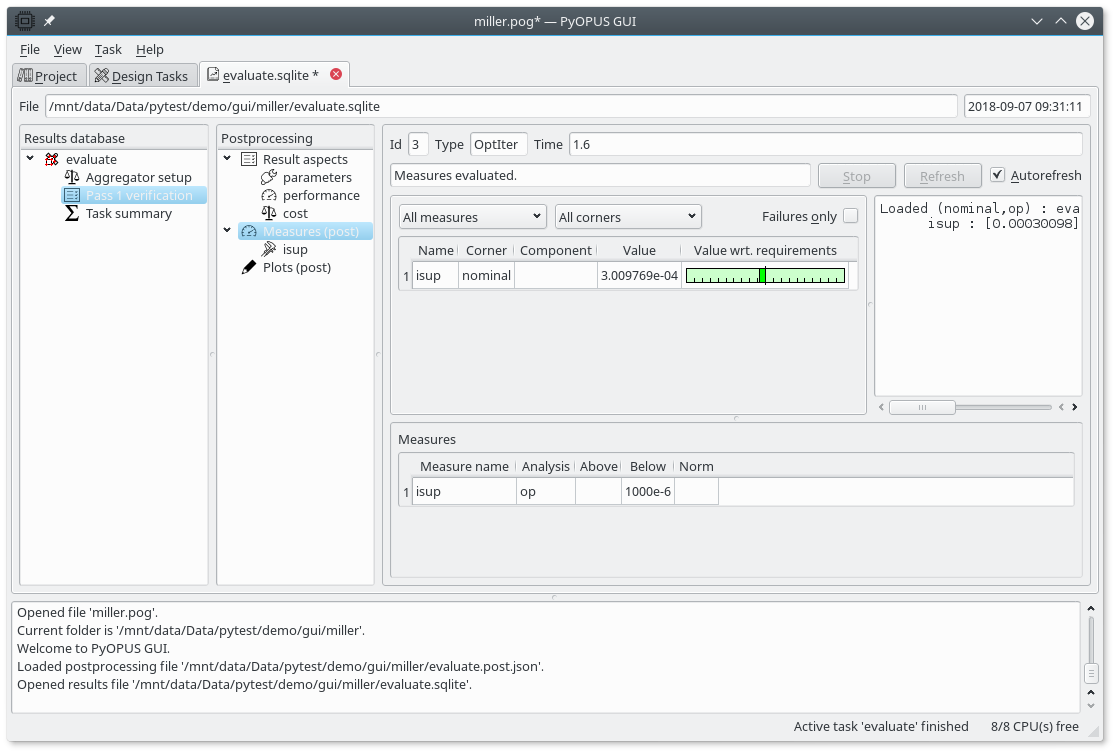
GUI displaying the summary of all defined postprocessing performance measures.
The bottom part is an editor where you define the performance measures. If the “Measures (post)” entry in the Postprocessing tree is selected this part displays a summary of all performance measures. This summary contains the name of the measure, the name of the analysis that generated the waveforms on which the measure will be evaluated, the lower and the upper bound defining the requirements imposed on the performance measure, and the norm. The norm is used for visualizing the performance measure value. One norm corresponds to one tick mark in the visualization. All entries in the table are editable.
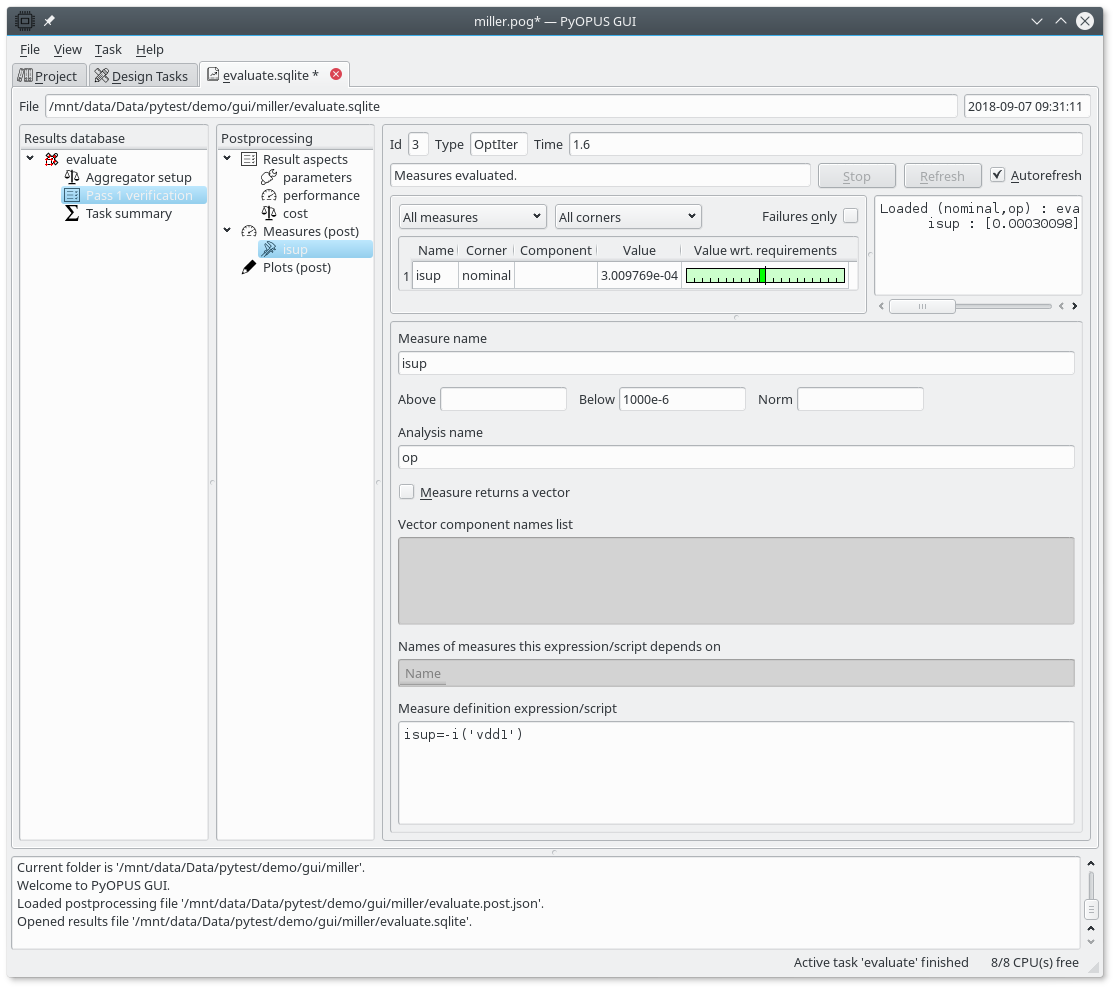
Editing a performance measure’s settings.
If a particular performance measure is selected the bottom part displays all of the settings associated with that performance measure.
- Measure name - it must be a valid identifier
- Above and Below - the lower and the upper bound on acceptable performance. If no bound is to be imposed, leave the respective fields empty. These two values are used for visualizing the performance measure’s value.
- Norm - the distance between tick marks in performacne measure visualisation. If unspecified it is set to the greater absolute value of the Above/Below fields. If the latter is zero 1 is used.
- Analysis name - the analysis that produces the waveforms from which the performance measure will be extracted. Can be empty if the performance measure is computed from parameter values and other performance measures that were computed from analysis results.
- Measure returns a vector - normally performance measures result in scalars. If a vector is obtained the performance measure is considered as failed. In some cases, however, it is of advantage to return a vector as the performance measure value. To indicate such mesures, check this checkbox.
- Vector component names list - vector components are by default named with consecutive numbers starting with 0. You can give arbitrary names to vector components by specifying a list of names or a hash expression that results in a Pythonic list of names. The expression can comprise variables defined in the project.
- Names of measures this expression/script depends on - for performance measures that are computed from other performance measures (Analysis name field is empty) the list of performance measures that are used in the measure definition must be specified here.
- Measure definition expression/script - Pythonic expression specifying how the value of the performance measure is computed. See sections pyopus.evaluator.performance — System performance evaluation, pyopus.evaluator.measure — Performance measure extraction, and Miller opamp design with PyOPUS for more information.
As an example we are going to add a measure named “isup”. You can add it either as a new child under “Measures (post)” in the Postprocessing tree or you can select the “Measures (post)” node and add it to the table summarizing all postprocessing performance measures (bottom right part of the results tab). Its settigns are displayed in the figure above. As soon as you enter everything the value of the performance measure will appear in the table in the top left part of the display. If you change the values in the Above/Below/Norm fields the ruler visualizing the performance measure will change accordingly.
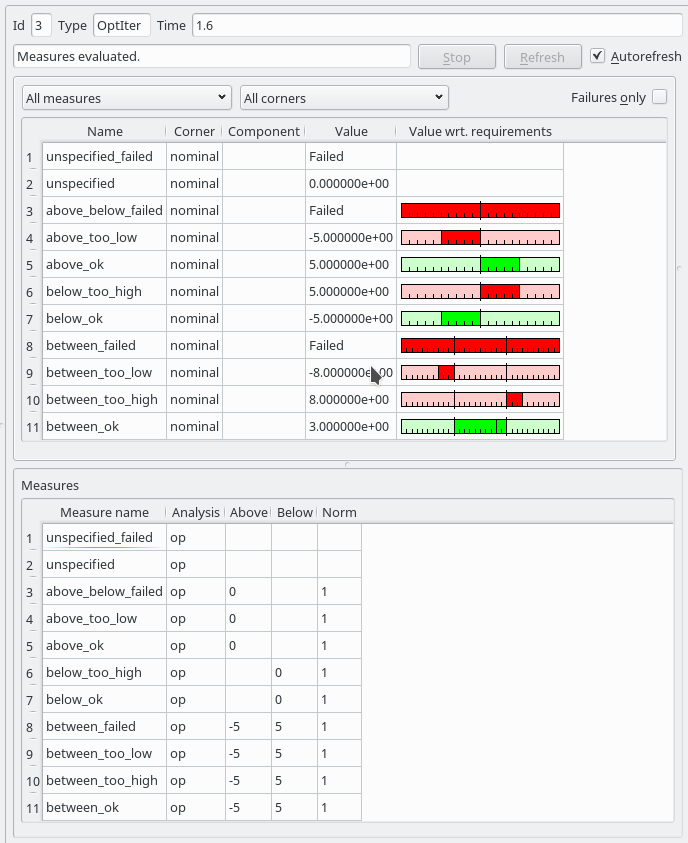
Visualisation of various combinations of performance measure value and imposed requirements.
The evaluation of defined performance measures produces messages that are
displayed in the top right part of the display. Reading these message can
help in debugging the definition of a performance measure. You can print an
arbitrary string in this window by calling the m.debug() function in
the definition of a performance measure.
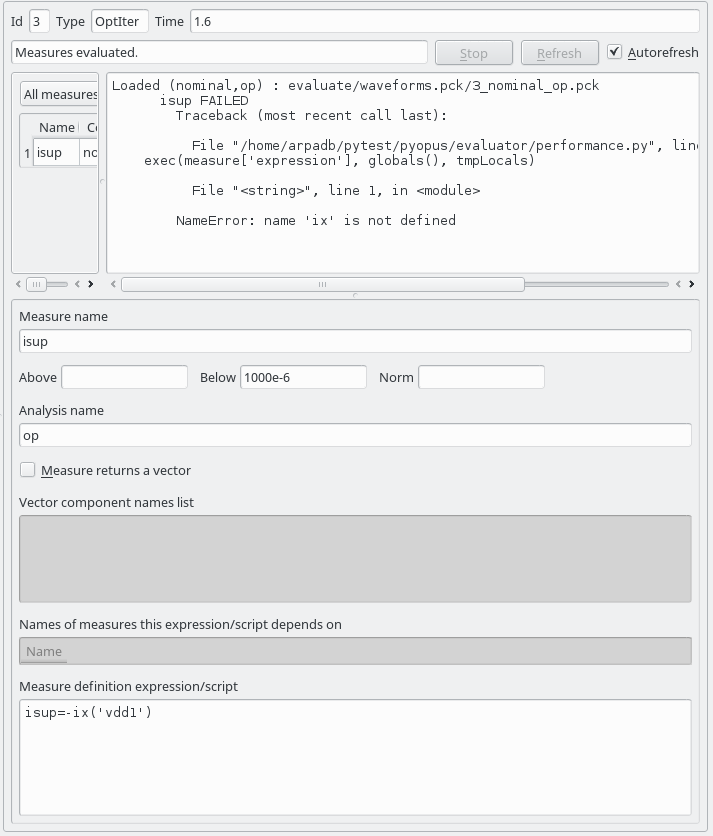
The output in the top-right part of the display can be used for debugging performance measures.
If the “Measures (post)” item in the Postprocessing tree is selected all performance measures are evaluated and visualized. If an individual performance measure is selected only that performance measure is evaluated and visualized.
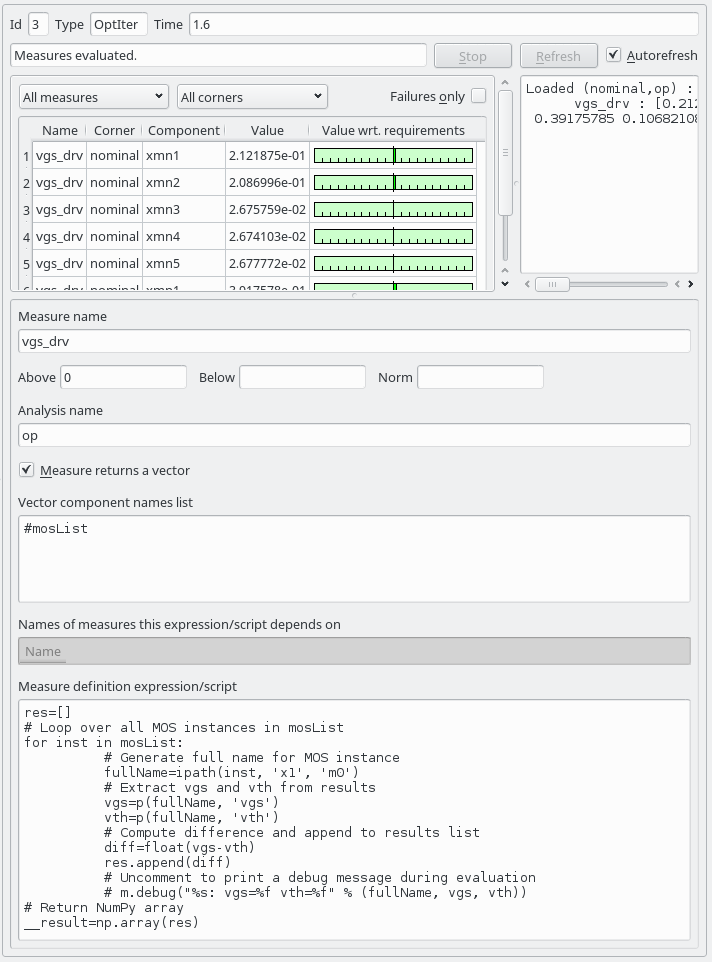
Defining a performance measure which results in a vector.
An example of a performance measure that results is a vector is in the figure
above. The component names are specified by variable mosList defined in the
project. The requirements imposed by fields Above and Below apply to all
components equally.
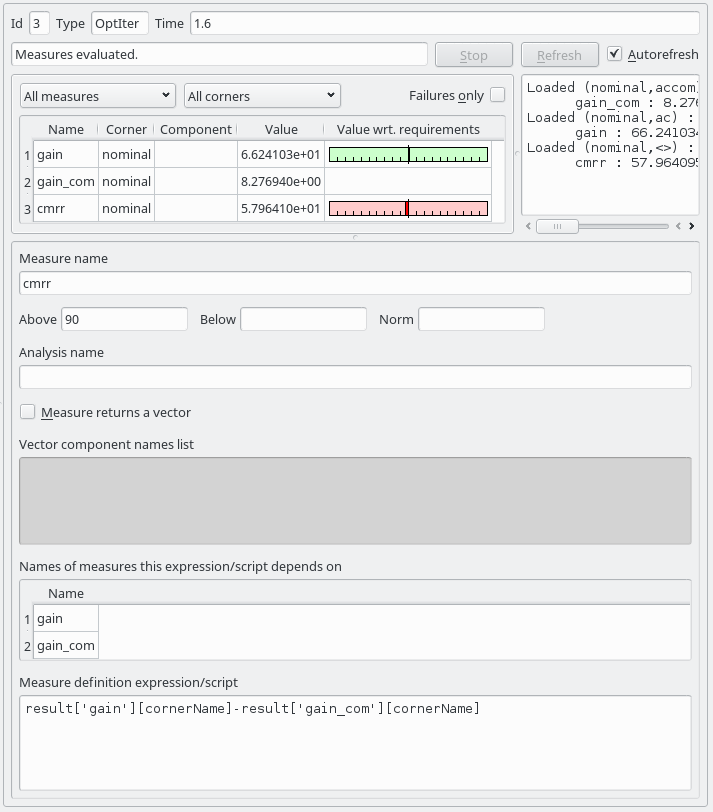
Defining a performance measure that is computed from other performance measures.
For a performance measure that depends on other performance measures all
the measures it depends on are evaluated and visualized. Other performance
measure values can be accessed is a two dimensional dictionary results. The
first key is the performance measure name and the second key is the corner name.
The name of the corner for which the measure is being evaluated is the
cornerName variable.

Defining a performance measure for the circuit’s area.
The area of an integrated circuit depends on its design parameters. They can
be accessed via the param dictionary with parameter name as key.