7.1. pyopus.wxmplplot.wxmplitf — WxPython canvas for displaying Matplotlib plots
wxPython canvas for displaying Matplotlib plots
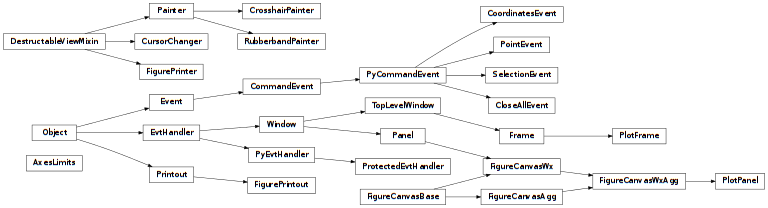
This module provides a wxPython canvas for Matplotlib to render its plots on. The canvas supports zooming and displays cursor position in axes coordinates as the cursor moves across the canvas.
A plot window is an object of the PlotFrame class. The canvas itself is an object of the PlotPanel class.
The module also provides print preview, printing, and saving of the plots to raster (e.g. PNG) or vector files (e.g. Postscript).
- class pyopus.wxmplplot.wxmplitf.PlotFrame(parent, id, title, lock, **kwargs)
A matplotlib canvas embedded in a wxPython window.
title is the title of the window. See wxPython documentation for parent and id.
lock is a Lock object that prevents other threads from accessing Matplotlib objects while wxPython events are handled. It is passed to the PlotPanel.
All remaining arguments are passed to the PlotPanel constructor.
- OnDestroy(evt)
Handler for wxPython window destruction events.
- OnMenuFileClose(evt)
Handles File->Close menu events.
- OnMenuFileCloseAll(evt)
Handles File->Close All menu events.
- OnMenuFilePageSetup(evt)
Handles File->Page Setup menu events
- OnMenuFilePrint(evt)
Handles File->Print menu events
- OnMenuFilePrintPreview(evt)
Handles File->Print Preview menu events
- OnMenuFileSave(evt)
Handles File->Save menu events.
- OnMenuHelpAbout(evt)
Handles Help->About menu events.
- PrintCoordinates(text)
Displays the formatted coordinates given by text in the status bar.
Creates the main menu of the window.
- draw()
Draw the associated Figure onto the screen. Shortcut to the PlotPanel’s forceDraw() method.
- get_figure()
Returns the figure associated with this canvas.
- get_panel()
Returns the plot panel object associated with this frame and its canvas.
- class pyopus.wxmplplot.wxmplitf.PlotPanel(parent, id, cursor=True, crosshairs=True, rubberband=True, point=True, selection=True, zoom=True, figpx=None, figsize=None, dpi=None)
A Matplotlib canvas suitable for embedding in wxPython applications.
Setting cursor, crosshairs, and rubberband to True enables the corresponding facilities of the canvas.
By setting point and selection to True the canvas emits PointEvent and SelectionEvent events.
Setting zoom to True enables zooming.
figsize is a tuple specifying the figure width and height in inches. Together with dpi they define the size of the figure in pixels.
figpx is a tuple with the horizontal and vertical size of the figure in pixels. If it is given it overrides the figsize setting. dpi is used for obtaining the figure size in inches.
For parent and id see wxPython documentation.
If neither figsize nor figpx are given the settings from matplotlibrc are used. The same holds for dpi.
Holding down the left button and moving the mouse selects the area to be zoomed. The zooming is performed when the button is released.
Right-clicking zooms out to the previous view.
Pressing the I key identifies the nearest curve.
- OnActivate(evt)
Handles the wxPython window activation event.
- OnDestroy(evt)
Handles the wxPython window destruction event.
- OnEraseBackground(evt)
Overrides the wxPython backround repainting event to reduce flicker.
- forceDraw()
Forces the drawing of the associated Figure onto the canvas.
- get_figure()
Returns the figure associated with this canvas.
A handler for matplotlib button_press_event events. Invoked every time a mouse button is pressed.
A handler for matplotlib button_release_event events. Invoked every time a mouse button is released.
- on_key_press_event(event)
A handler for matplotlib key_press_event events. Invoked every time a key is pressed.
- on_motion_notify_event(event)
A handler for matplotlib motion_notify_event events. Invoked every time mouse moves across the canvas and on when a mouse button is released.
- on_pick_event(event)
A handler for matplotlib pick_event events. Invoked every time user picks a location close to some object.
- set_crosshairs(state)
Enable or disable drawing crosshairs through the mouse cursor when it is inside a matplotlib axes.
- set_cursor(state)
Enable or disable the changing mouse cursor. When enabled, the cursor changes from the normal arrow to a square cross when the mouse enters a Matplotlib axes on this canvas.
- set_point(state)
Enable or disable point events.
- set_repaint(state)
Enable or disable repainting.
- set_rubberband(state)
Enable or disable drawing a rubberband.
- set_selection(state)
Enable or disable selection events.
- set_zoom(state)
Enable or disable zooming in/out when the user makes an area selection or right-clicks the axes.
- class pyopus.wxmplplot.wxmplitf.AxesLimits
Stores the zoom history for Matplotlib Axes objects. The history is stored in a WeakKeyDictionary with Axes objects for keys.
History is a list of tuples of the form (xlim, ylim) where xlim and ylim are the return values of the get_xlim() and get_ylim() methods of the corresponding Axes object.
Alters the X and Y limits of C{Axes} objects while maintaining a history of the changes.
- restore(axes)
Changes the X and Y limits of C{axes} to their previous values obtained from teh corresponding history list. A boolean indicating whether or not the axes should be redrawn is returned, because polar axes cannot have their limits changed sensibly.
- set(axes, xrange, yrange)
Changes the X and Y limits of axes to xrange and yrange respectively by calling the set_xlim() and set_ylim() methods of the axes object. The old state of axes is stored in the history list. A boolean indicating whether or not the axes should be redrawn is returned, because polar axes cannot have their limits changed sensibly.
- zoomed(axes)
Returns a boolean indicating whether axes has had its limits altered.
- class pyopus.wxmplplot.wxmplitf.DestructableViewMixin
Utility class to break the circular reference between an object and its associated “view”.
- destroy()
Sets this object’s view- attribute to None.
- class pyopus.wxmplplot.wxmplitf.Painter(view, enabled=True)
Painters encapsulate the mechanics of drawing some value in a wxPython window and erasing it. Subclasses override template methods to process values and draw them.
The PEN and BRUSH members specify the wx.Pen and wx.Brush objects to use for drawing (defaults are wx.BLACK_PEN and wx.TRANSPARENT_BRUSH).
FUNCTION is the logical function to use for drawing (defaults to wx.COPY).
The font is specified with the FONT member (a wx.Font object, defaults to wx.NORMAL_FONT).
The TEXT_FOREGROUND and the TEXT_BACKGROUND members specify the wx.Colour objects for text (defaults are wx.BLACK and wx.WHITE).
view specifies the wxPython window to which the new Painter object is attached. The enabled argument sets the state of this painter (True for enabled).
- clear(dc=None)
Clear the painter’s current value from the screen and the painter itself using wxPython device context dc. Returns last formatted value.
- clearValue(dc, value)
Template method that clears a previously processed value that was previously drawn, using the wxPython device context dc. This DC has already been configured, so calls to the BeginDrawing() and EndDrawing() methods may not be made.
- drawValue(dc, value)
Template method that draws a previously processed value using the wxPython device context dc. This DC has already been configured, so calls to the BeginDrawing() and EndDrawing() methods may not be made.
- formatValue(value)
Template method that processes the value tuple passed to the set() method, returning the processed version.
- getEnabled()
Return the enabled state of this painter.
- redraw(dc=None, restoreValue=None)
Redraw this painter’s current value using wxPython device context dc. If restoreValue is not None, the formatted value is restored from restoreValue. In the latter case the painter must be cleared first.
- set(*value)
Update this painter’s value and then draw it. value is a tuple of arguments representing the new value of the painter. The painter stores the value as a formatted value in the value member. Value may not be None, which is used internally to represent the absence of a current value.
- class pyopus.wxmplplot.wxmplitf.CrosshairPainter(view, enabled=True)
Draws crosshairs through the current position of the mouse.
value is a tuple of the form (x, y) specifying the coordinates for the DC where the crosshair will be painted or erased.
- clearValue(dc, value)
Clears the crosshairs drawn through the (X, Y) coordinates using wxPython device context dc.
- drawValue(dc, value)
Draws crosshairs through the (X, Y) coordinates using wxPython device context dc.
- class pyopus.wxmplplot.wxmplitf.RubberbandPainter(view, enabled=True)
Draws a selection rubberband from one point to another.
value is a tuple of the form (x1, y1, x2, y2) specifying the position of the rubberband in Matplotlib mouse coordinates.
- clearValue(dc, value)
Clears the selection rubberband around the rectangle specified by the (x1, y1, x2, y2) tuple in value using exPython device context dc.
- drawValue(dc, value)
Draws the selection rubberband around the rectangle specified by the (x1, y1, x2, y2) tuple in value using exPython device context dc.
- formatValue(value)
Converts the (x1, y1, x2, y2) mouse coordinates from Matplotlib to wxPython. Basically makes sure that x1<=x2, y1<=y2, and coordinates are integer.
- class pyopus.wxmplplot.wxmplitf.CursorChanger(view, enabled=True)
Manages the current cursor of a wxPython window, allowing it to be switched between a normal arrow (when no crosshair is plotted) and a square cross (when crosshair is plotted).
- setCross()
Change the cursor of the associated window to a square cross.
- setEnabled(state)
Enable or disable this cursor changer. When disabled, the cursor is reset to the normal arrow and calls to the set() methods have no effect.
- setNormal()
Change the cursor of the associated window to a normal arrow.
- class pyopus.wxmplplot.wxmplitf.FigurePrinter(view)
Provides a simplified interface to the wxPython printing framework that’s designed for printing Matplotlib figures.
- id = <module 'wx.xrc' from '/usr/lib/python2.7/dist-packages/wx-3.0-gtk2/wx/xrc.pyc'>
- pageSetup()
Opens a page setup dialog. Collects settings and stores them as static members in the FigurePrinter class so they become persistent across plot windows.
- previewFigure(figure, title=None)
Open a “Print Preview” window for the matplotlib figure. The keyword argument title provides the printing framework with a title for the print job.
- printFigure(figure, title=None)
Open a “Print” dialog to print the matplotlib chart figure. The keyword argument title provides the printing framework with a title for the print job.
- class pyopus.wxmplplot.wxmplitf.FigurePrintout(figure, title=None, marginTL=(5, 5), marginBR=(5, 5), scaleFigure=True, keepAspect=True)
Render a matplotlib Figure object figure to a page or file using wxPython’s printing framework. title is used for the print job title.
marginTL and marginBR specify the top-left and the bottom-right margins in the form of tuples with two members (i.e. (left, top) and (right, bottom)). The margins are in millimeters.
If scaleFigure is True the figure is scaled to the paper size. If keepAspect is not True the aspect ration of the figure can be broken when the figure is scaled to the paper size.
The figure is rendered as a raster image. The DPI setting of the printer is used for image rasterization.
Use the print_figure() method of the PlotPanel class (inherited from its base class) for saving vector images in a vector format (i.e. Postscript).
- GetPageInfo()
Overrides wx.Printout.GetPageInfo() to provide the printing framework with the number of pages in this print job.
- OnPrintPage(pageNumber)
Overrides wx.Printout.OnPrintPage to render the matplotlib figure to a printing device context.
- render_figure_as_image(wFig, hFig, dpi)
Renders a Matplotlib figure using the Agg backend and stores the result in a class:wx.Image. The arguments wFig and hFig are the width and the height of the figure, and dpi is the dots-per-inch to render at.
- pyopus.wxmplplot.wxmplitf.EVT_POINT_ID = 112
The wxPython identifier of a PointEvent event.
- pyopus.wxmplplot.wxmplitf.EVT_SELECTION_ID = 113
The wxPython identifier of a SelectionEvent event.
- pyopus.wxmplplot.wxmplitf.EVT_COORDINATES_ID = 114
The wxPython identifier of a CoordinatesEvent event.
- pyopus.wxmplplot.wxmplitf.EVT_CLOSEALL_ID = 115
The wxPython identifier of a CloseAll event.
- pyopus.wxmplplot.wxmplitf.EVT_POINT(win, id, func)
Register to receive wxPython PointEvent events from a PlotPanel or PlotFrame. The events originating from win are to be handled by function func.
id is the identifier to be associated with the event.
- pyopus.wxmplplot.wxmplitf.EVT_SELECTION(win, id, func)
Register to receive wxPython SelectionEvent events from a PlotPanel or PlotFrame. The events originating from win are to be handled by function func.
id is the identifier to be associated with the event.