10.1.6. Scaling the axes
File 06-scaling.py in folder demo/plotting/
import pyopus.plotter as pyopl
from numpy import arange, sin, cos, exp, pi, e
if __name__ == '__main__':
# Initialize gui thread, clean up.
pyopl.init()
pyopl.close()
# Plot data - sin(x), cos(x), exp(x/pi) .. for x in [0, 2pi] with 0.2 step.
x = arange(0.0, 2*pi, 0.2)
y1 = sin(x)
y2 = cos(x)
y3 = exp(x/pi)
# Plot window
f1=pyopl.figure(windowTitle="Scaling", figpx=(800,400), dpi=100)
# Lock GUI
pyopl.lock(True)
# Check if figure is alive
if pyopl.alive(f1):
# Create 2 subplots, horizontal stack of 2
ax1=f1.add_subplot(1,2,1)
ax2=f1.add_subplot(1,2,2)
# First axes
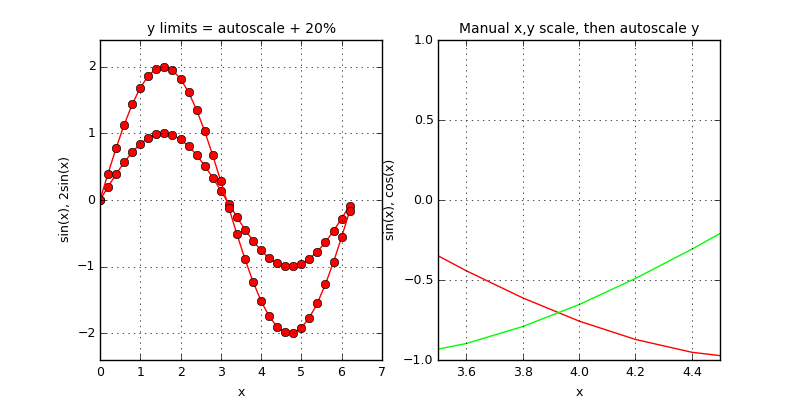
ax1.plot(x, y1, '-o', label='sin(x)', color=(1,0,0))
ax1.plot(x, 2*y1, '-o', label='2sin(x)', color=(1,0,0))
ax1.grid(True)
ax1.set_xlabel('x')
ax1.set_ylabel('sin(x), 2sin(x)')
ax1.set_title('y limits = autoscale + 20%')
# Get y limits
yl=ax1.get_ylim()
print("y limits: "+str(yl))
# Limits are set as two positional arguments, expand by 20%
ax1.set_ylim(yl[0]*1.2, yl[1]*1.2)
# Second axes
ax2.plot(x, y1, '-', label='sin(x)', color=(1,0,0))
ax2.plot(x, y2, '-', label='cos(x)', color=(0,1,0))
ax2.grid(True)
ax2.set_xlabel('x')
ax2.set_ylabel('sin(x), cos(x)')
ax2.set_title('Manual x,y scale, then autoscale y')
# Set x and y limits
ax2.set_xlim(3.5, 4.5)
ax2.set_ylim(-4.0, 4.0)
# Autoscale only y
ax2.autoscale(axis='y')
# Draw figure on screen
pyopl.draw(f1)
# Unlock GUI
pyopl.lock(False)
# Handle keyboard interrupts properly.
pyopl.join()